Analysis on Demand (ANODE) Software Application
Role: Design Lead
Dominion Energy needed a robust analytics tool to streamline real-time monitoring and analysis of grid assets. The existing tools likely lacked intuitive visualization, leading to information overload, slow decision-making, and difficulty surfacing critical insights.
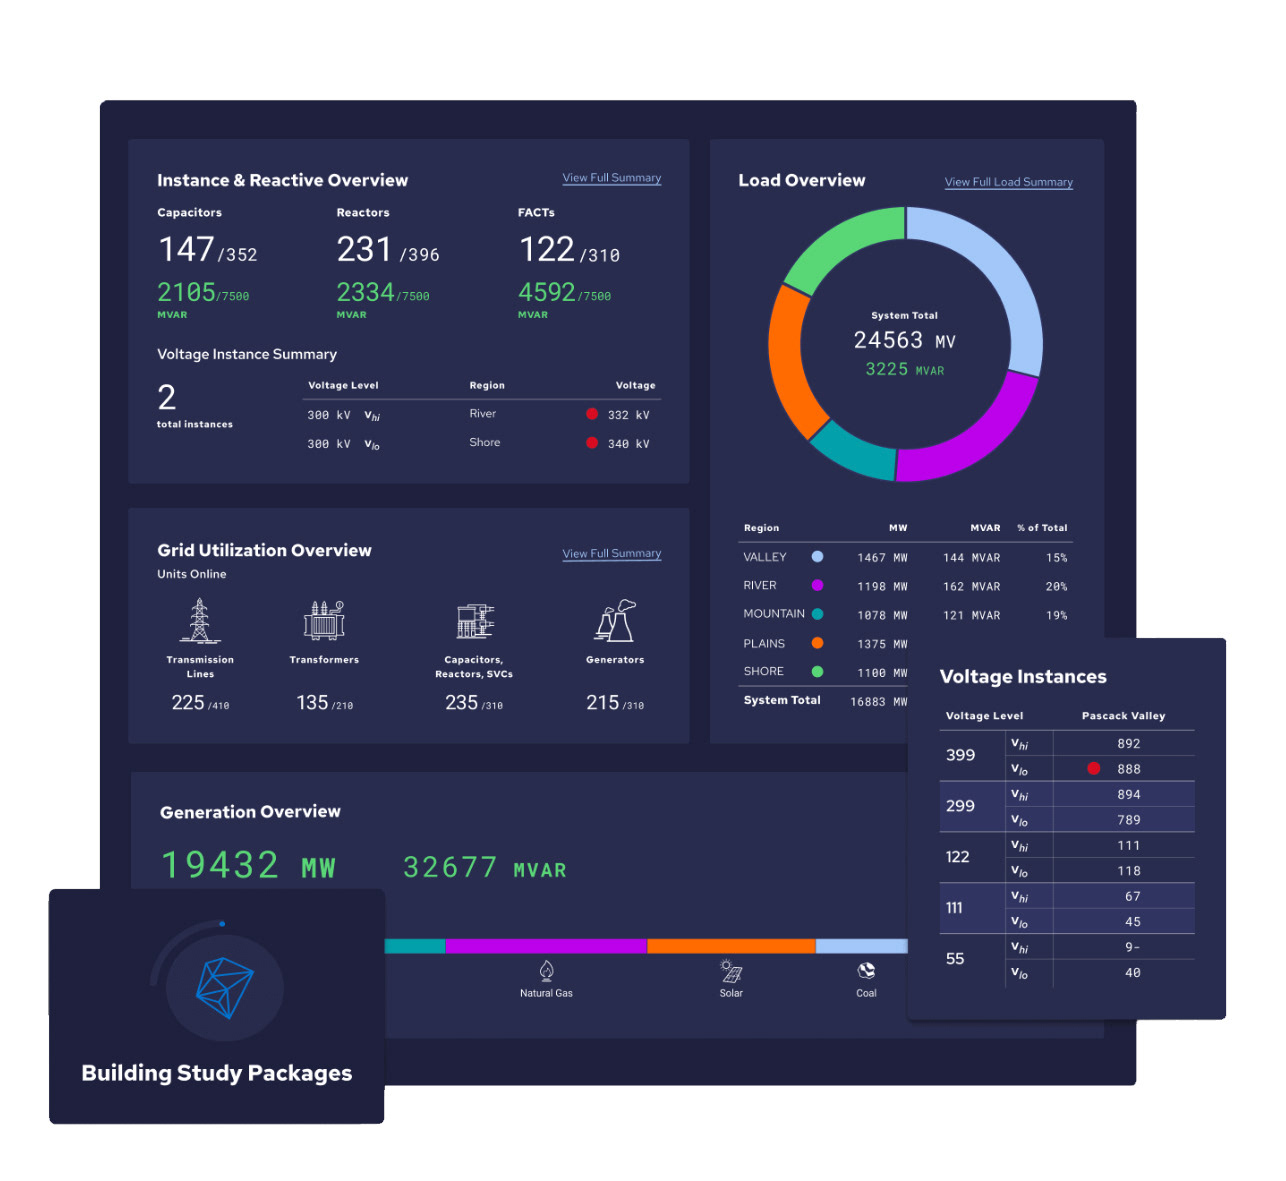
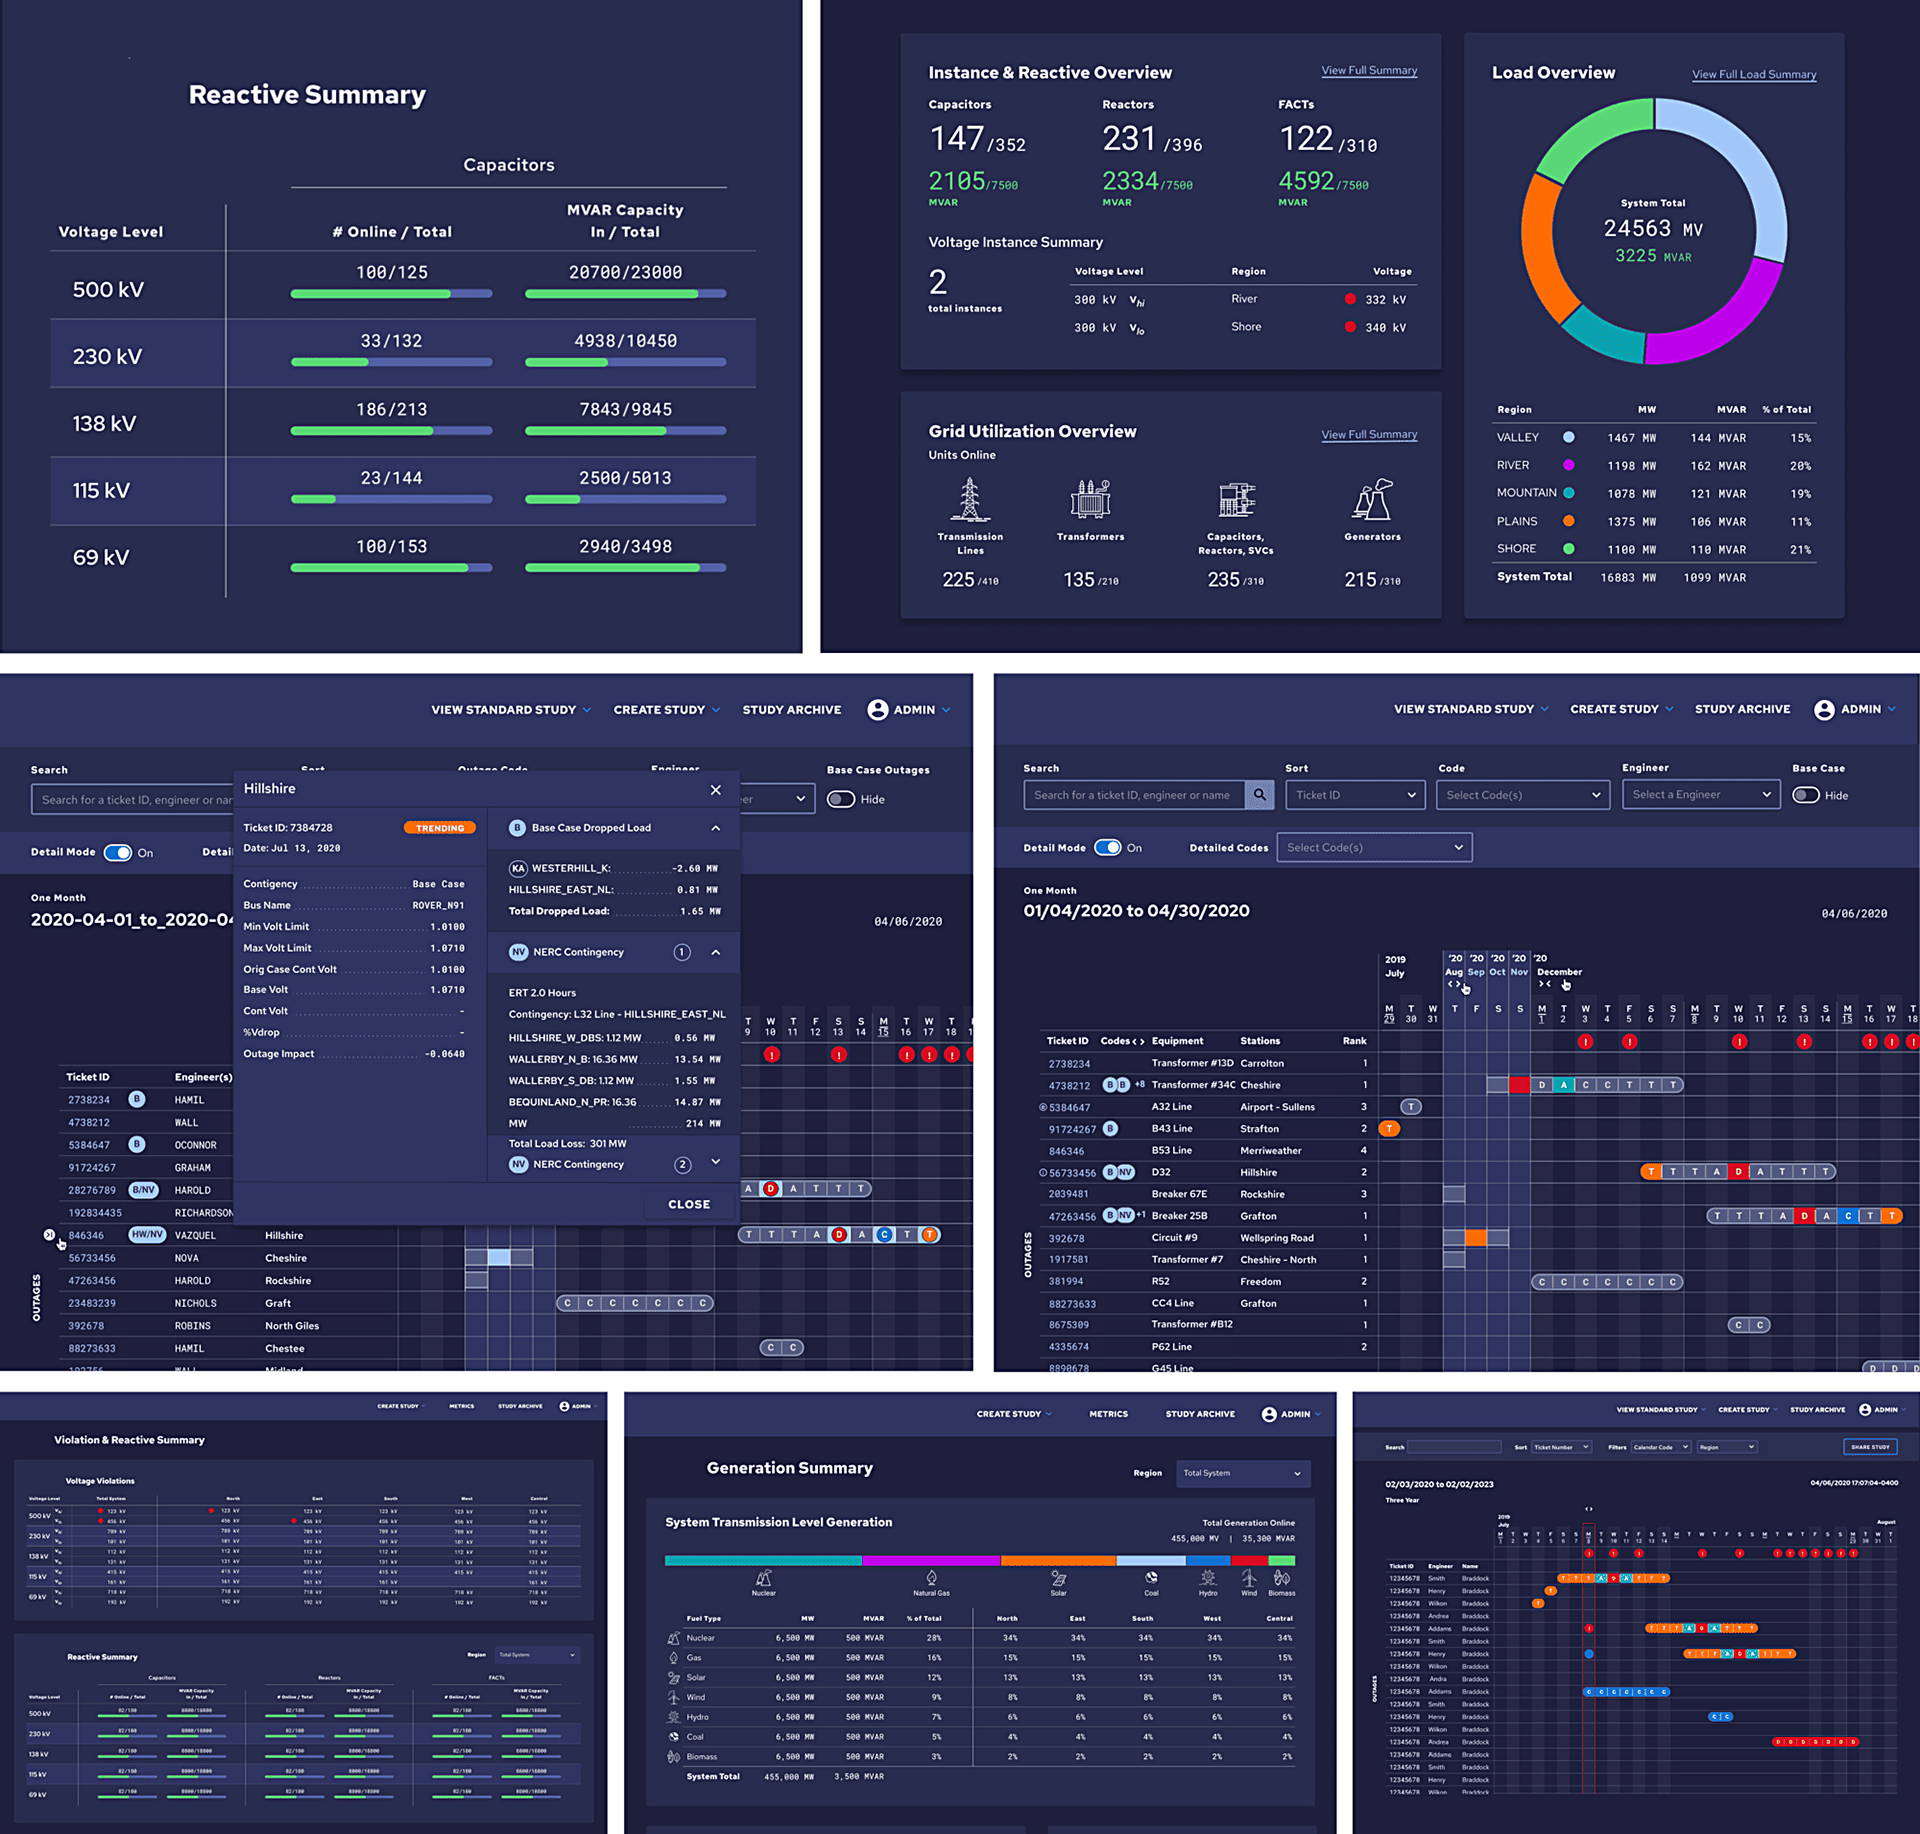
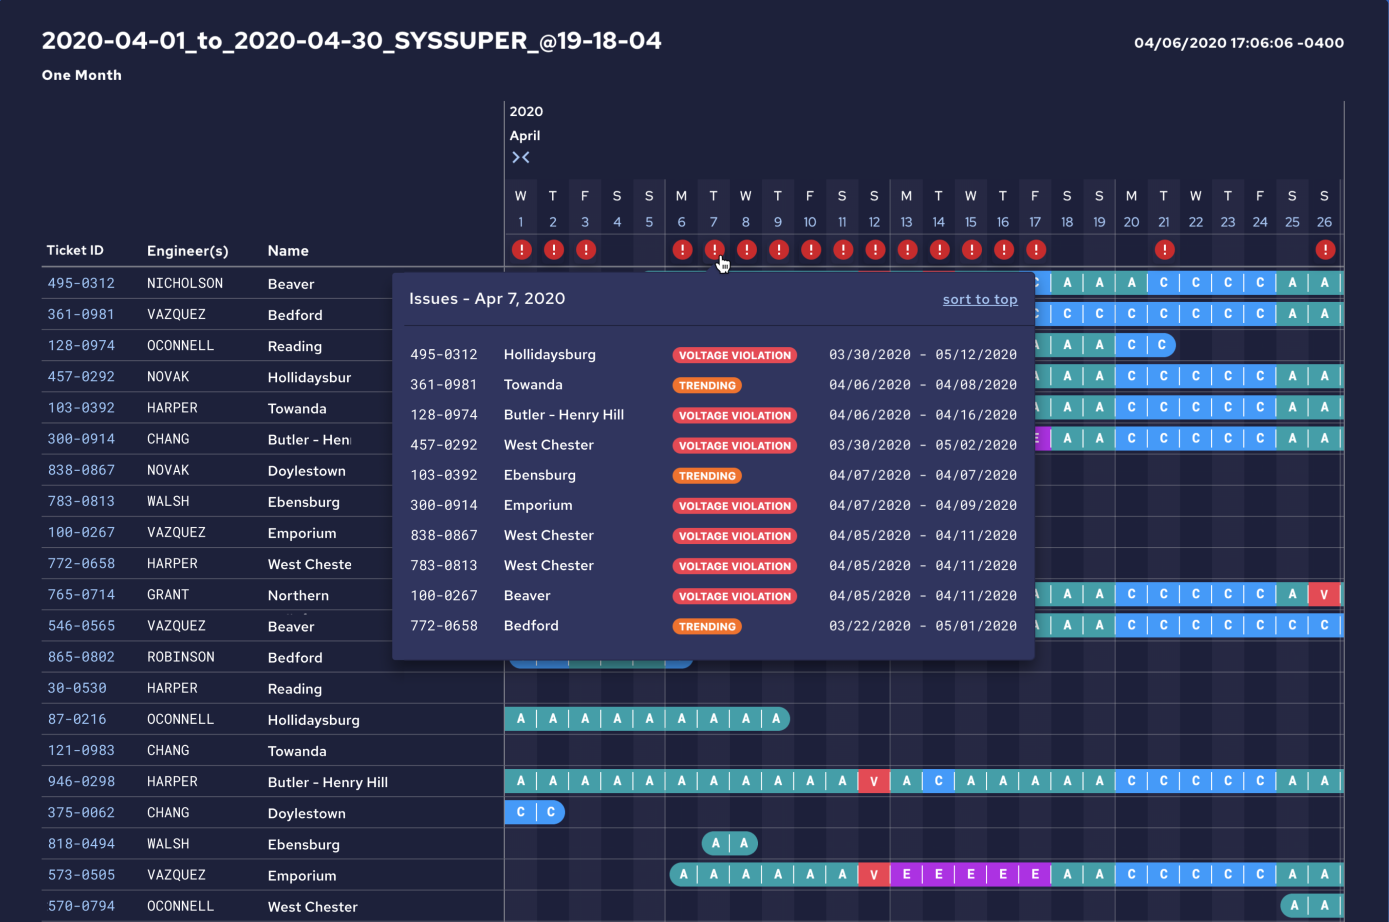
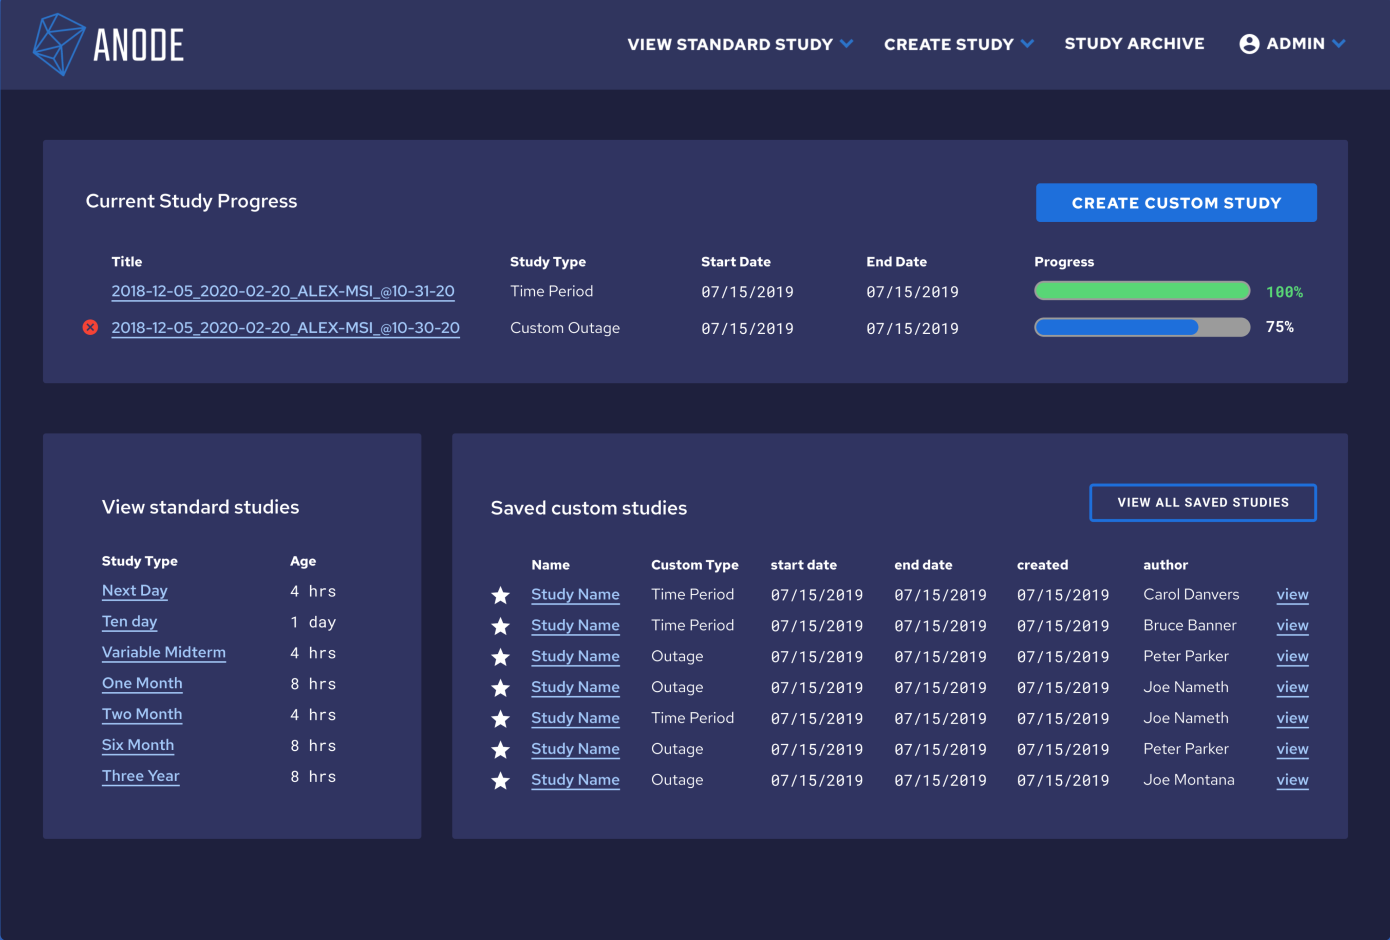
ANODE, a sleek, dashboard-driven interface featuring clear data hierarchy, interactive charts (including radial visualizations), and intuitive controls was our solution. The design surfaces the most relevant performance metrics at a glance, empowering engineers to monitor trends, detect anomalies, and take proactive action with confidence.
Process Highlights
Research & Discovery: Collaborated with power system analysts and engineers to understand common metrics and pain points—in particular, how data complexity hindered efficient operations.
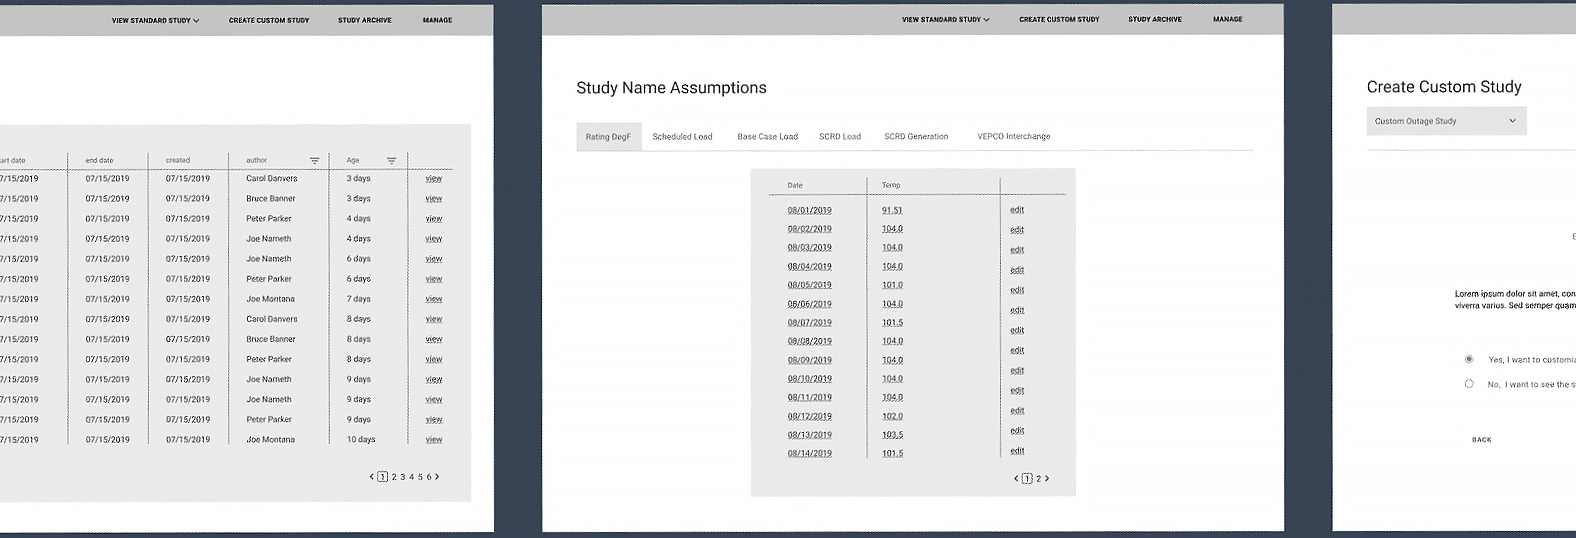
Wireframing & Prototyping: Iteratively developed wireframes that emphasized data clarity and hierarchy, experimenting with chart types (e.g., radial, bar, line) for different purposes.
Visual Design & Usability: Crafted a clean, dark-themed UI to reduce visual fatigue and enhance contrast for data elements. Designed reusable component patterns for tables, charts, and status indicators to maintain consistency.
Feedback Loops: Conducted usability sessions with Dominion’s teams to validate visual clarity and navigation. Adjusted components based on real-world tasks, such as filtering, drill-down interactions, and alert integration.
Intended Outcome
The refined dashboard reduced time to critical insight detection, improved situational awareness, and facilitated faster response to grid fluctuations.
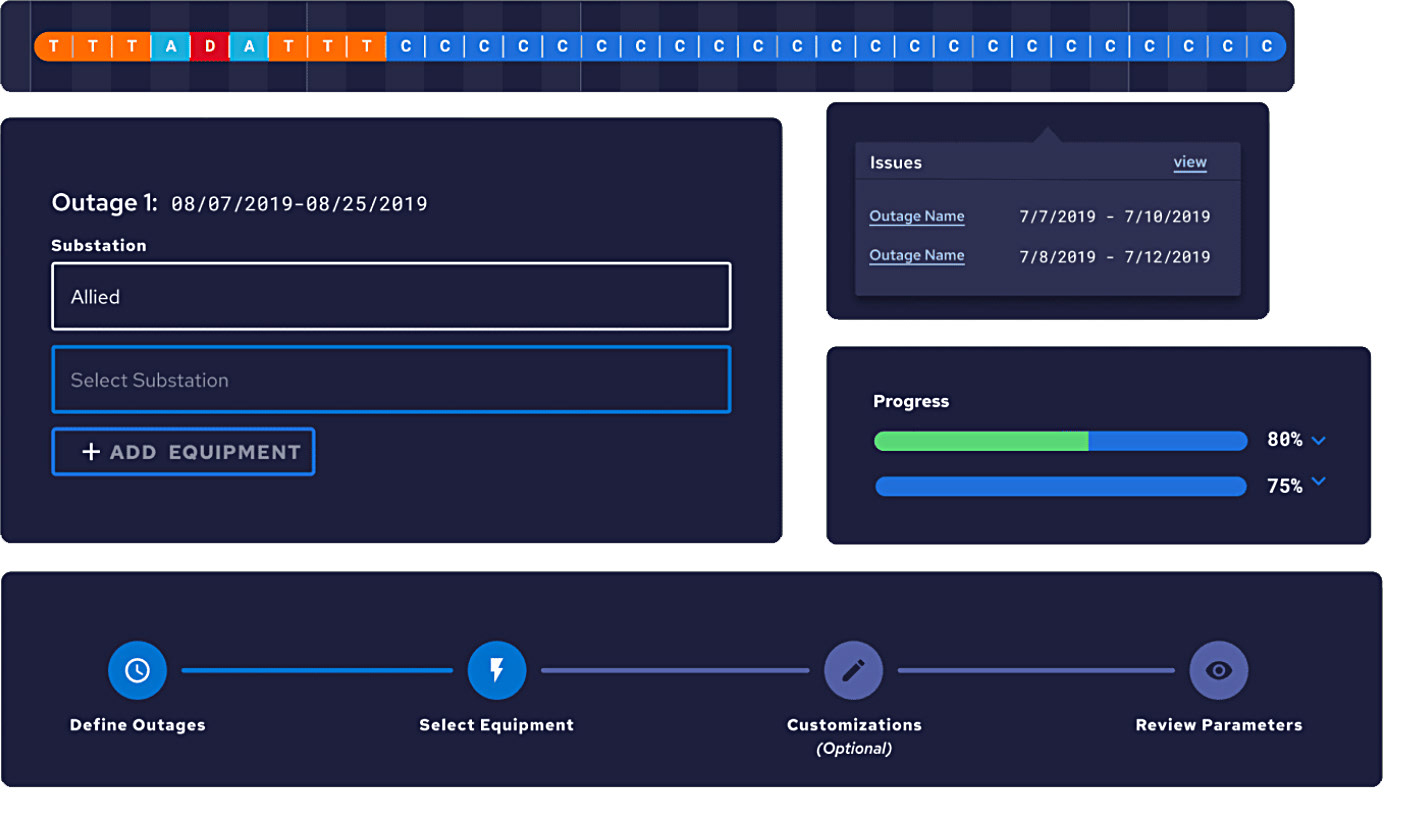
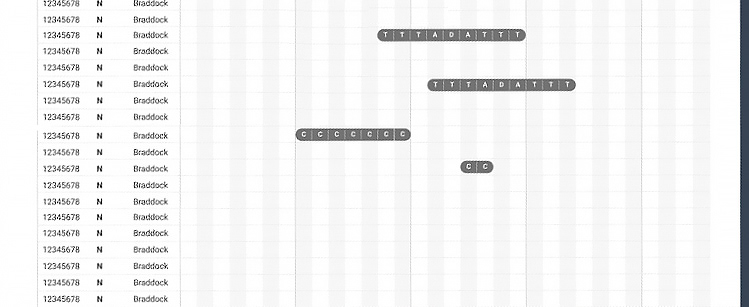
Various ANODE Interface Components
ANODE Wireframes
Additional ANODE Screens
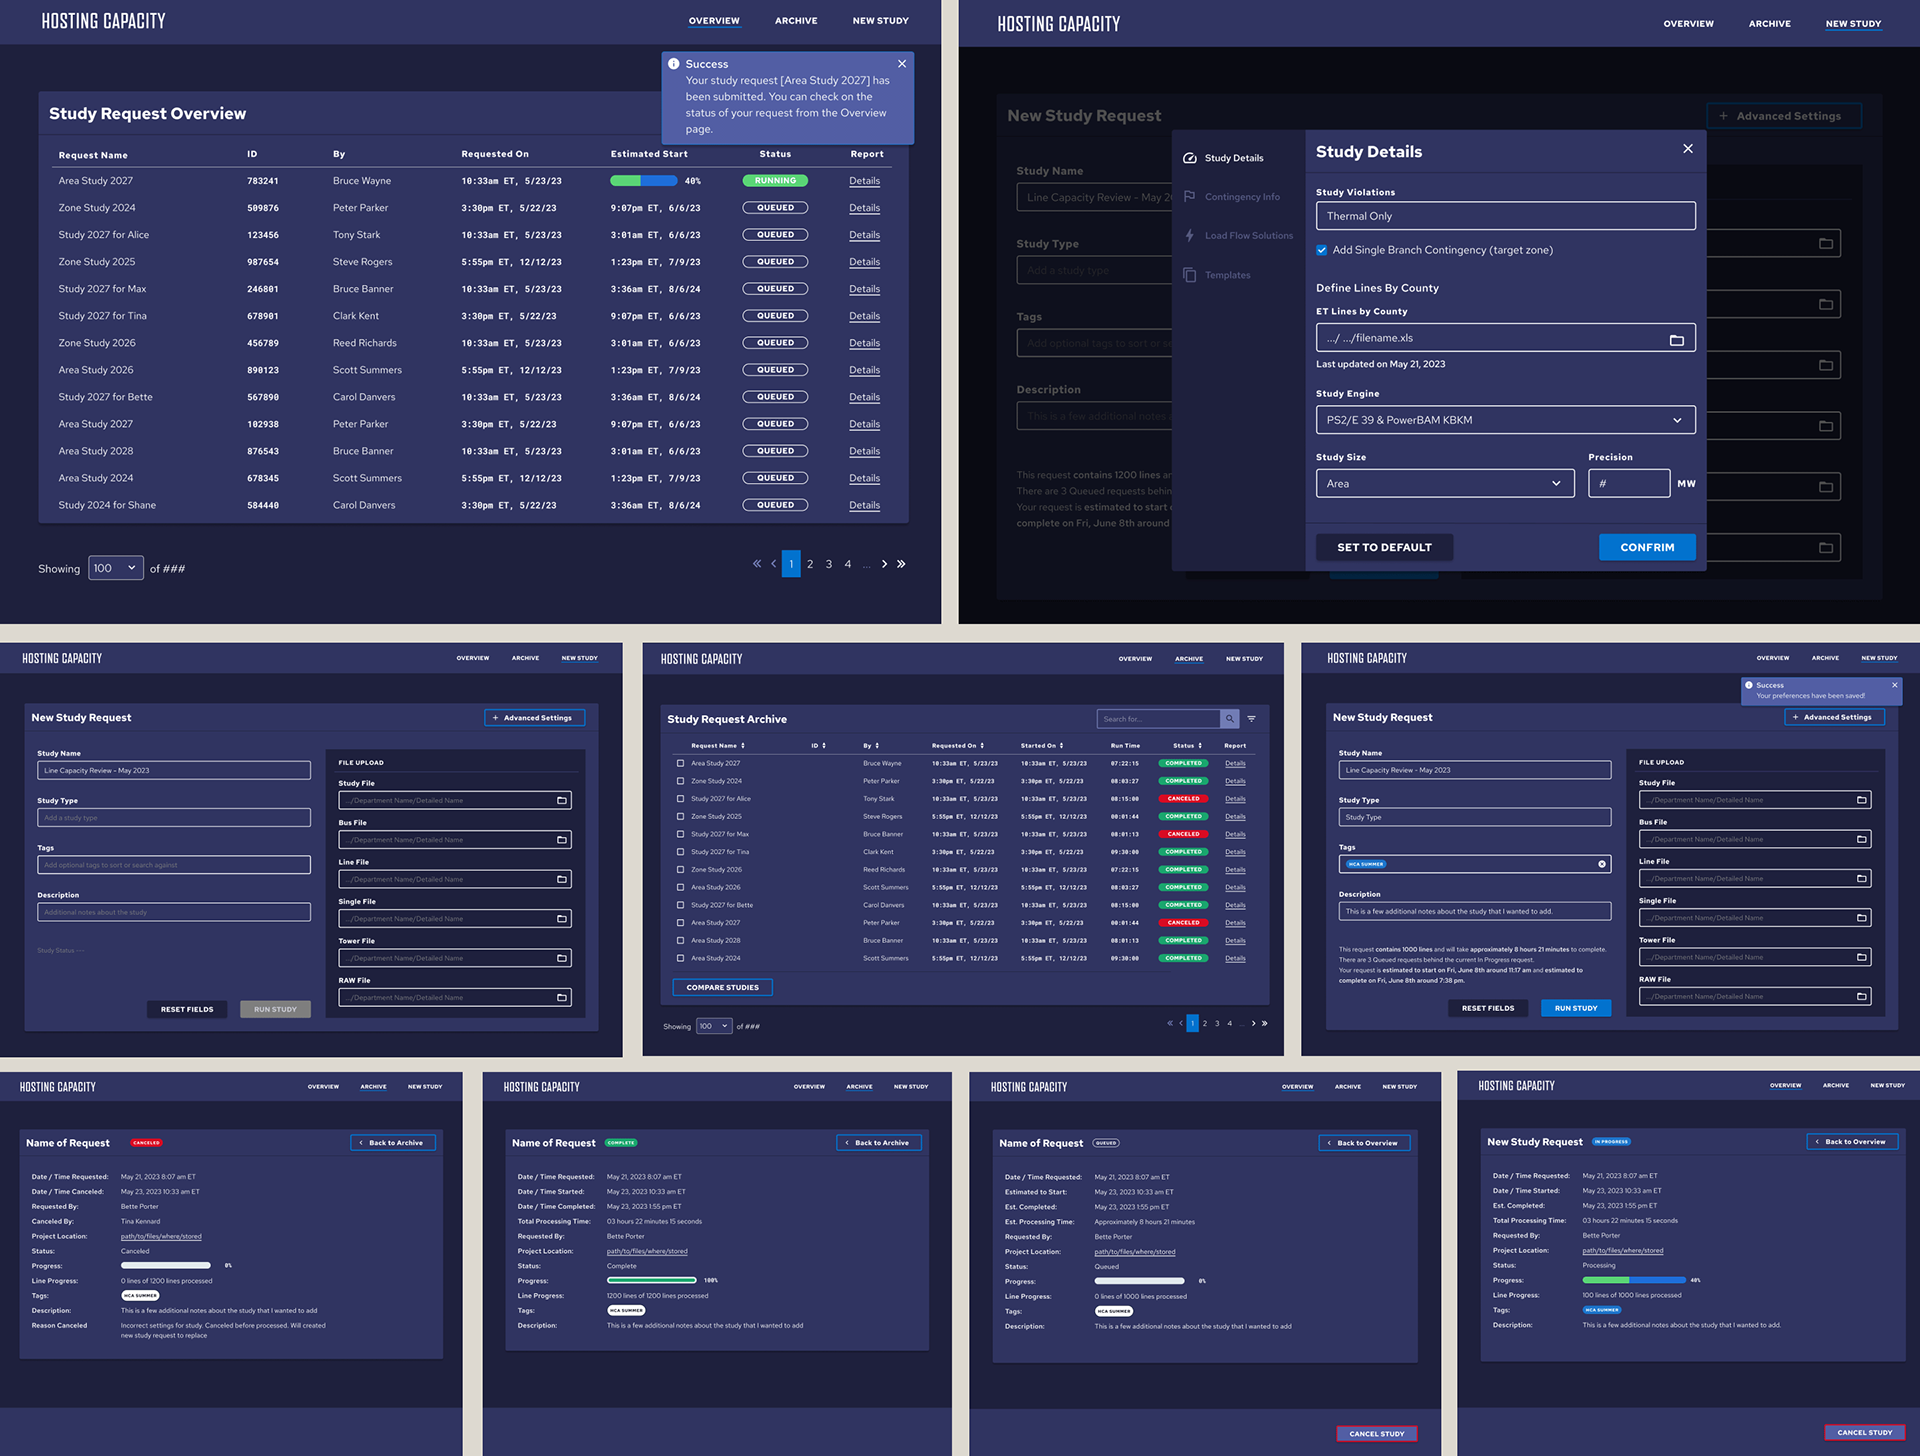
Hosting Capacity Analysis (HCA) Software Application
Role: Design Lead
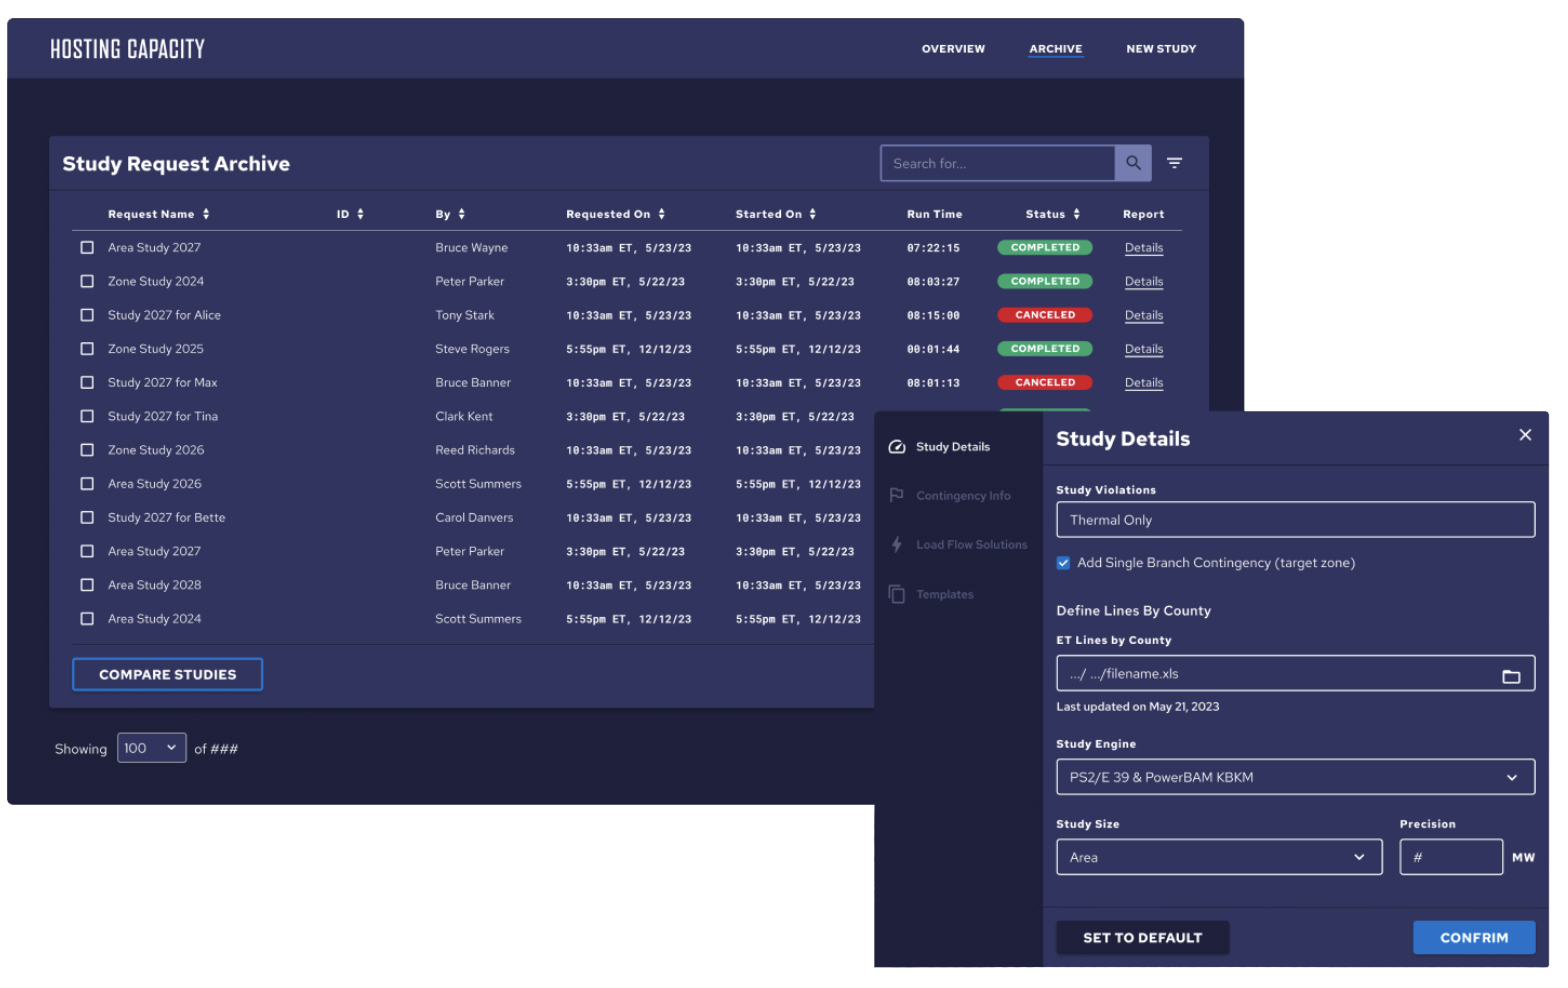
Additional HCA Interface Components
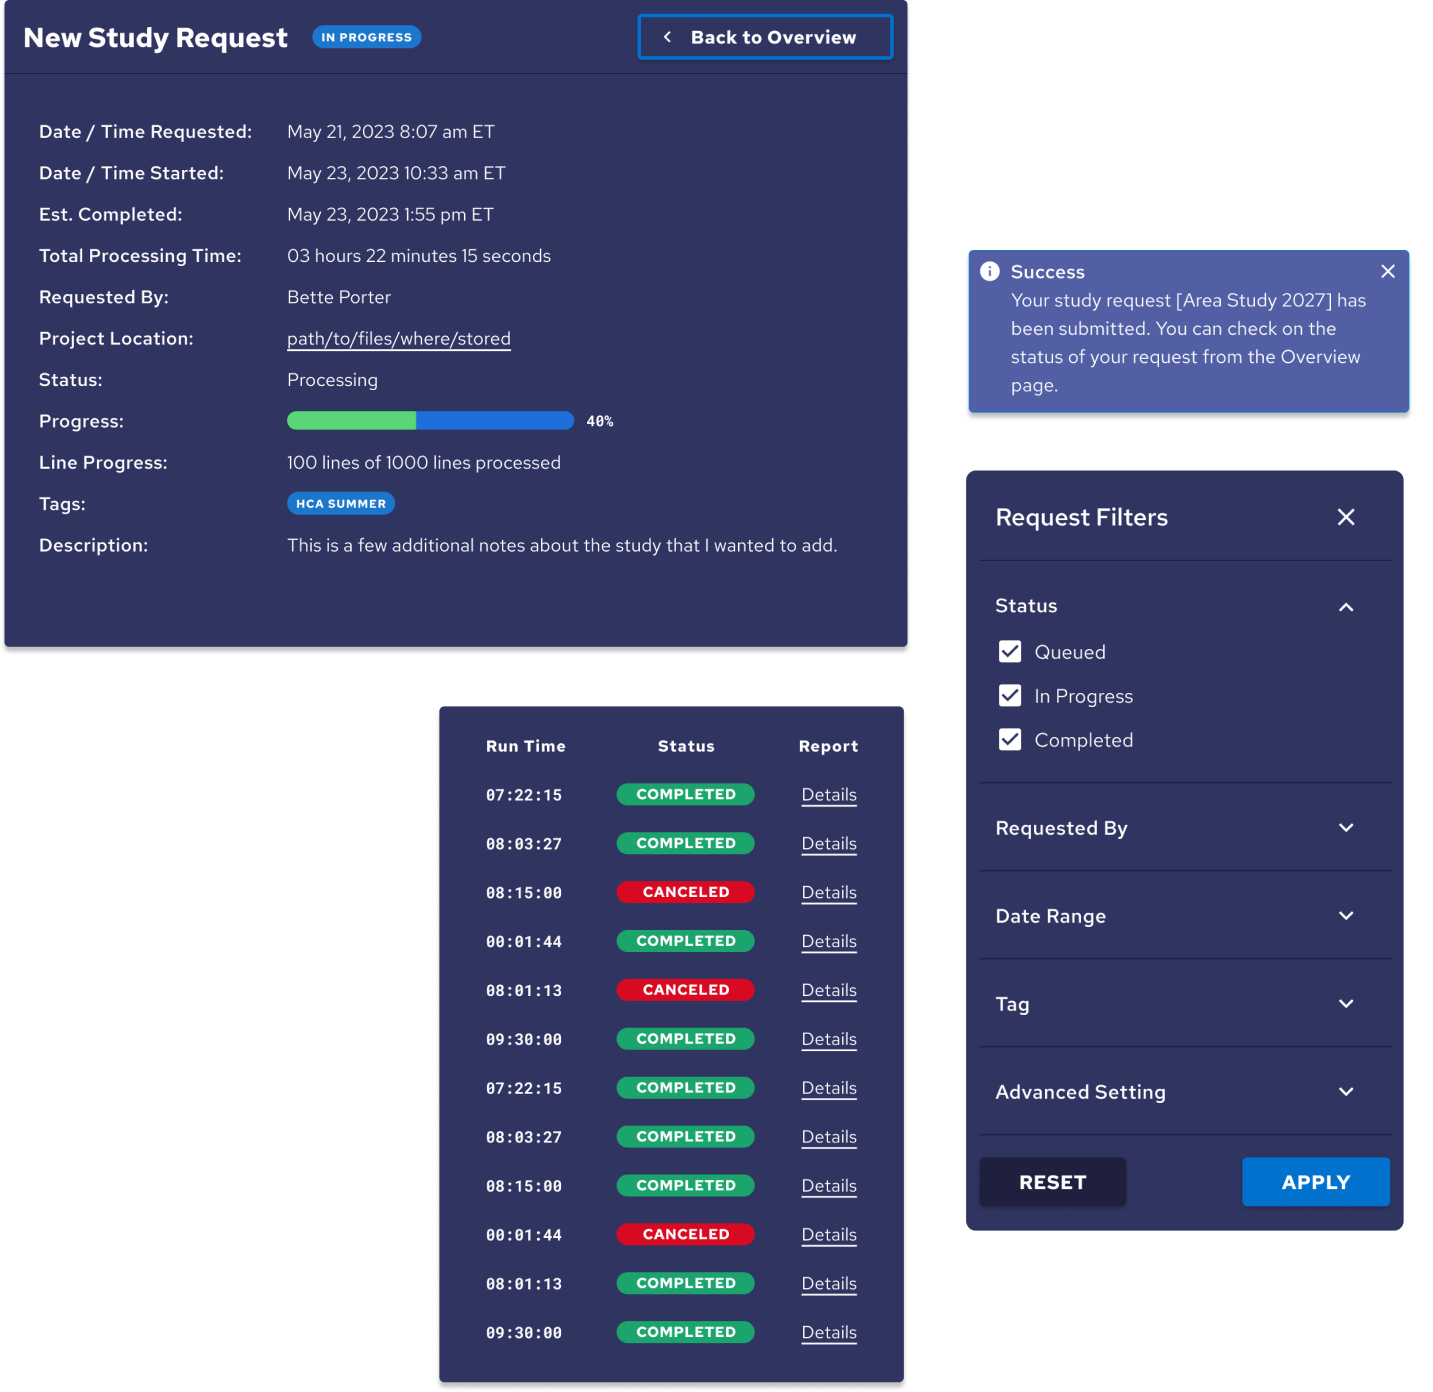
Additional HCA Screens